Custom interactive dashboard in excel
The previous post on excel dashboards walked through an example.
Here I make my own custom Operations and Marketing dashboards using the concepts learned from there.
I’m fortunate in that I’ve got control over webservers, DB and storage, and can design my own log strategy.
TODO
- share dashboard using Office365?
- IP country and town lookups
Summary
We’re going to be using
- Live connection to Azure SQL with a readonly user
- Excel Table to store data
- PivotTable for each chart
- PivotChart
- Map Chart
- Slicer
- Dynamic Labelling
Import Live Data
https://docs.microsoft.com/en-us/azure/azure-sql/database/connect-excel
Create a readonly user on Azure for safety. SO
CREATE LOGIN davereadonly WITH PASSWORD = 'secretpassword'

-- master so can login to SSMS
CREATE USER davereadonlyuser FROM LOGIN davereadonly;

-- osr4rights
CREATE USER davereadonlyuser FROM LOGIN davereadonly;
EXEC sp_addrolemember 'db_datareader', 'davereadonlyuser';
Then login
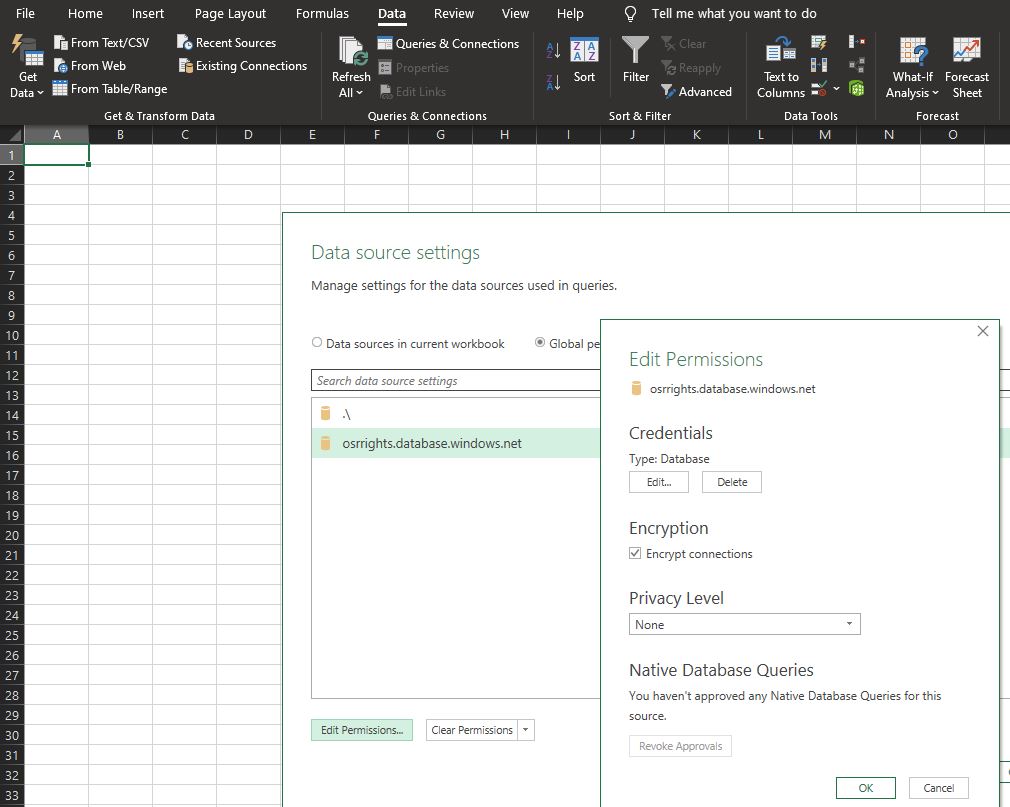
To modify the cached connection string (which is global on the computer)
Data, Get Data, SQL Server Database There is a Power Query Editor where I can transform data if needed.
After loading I get 19,955 rows of data in an Excel Table.
Rename the Table and worksheet to Data.
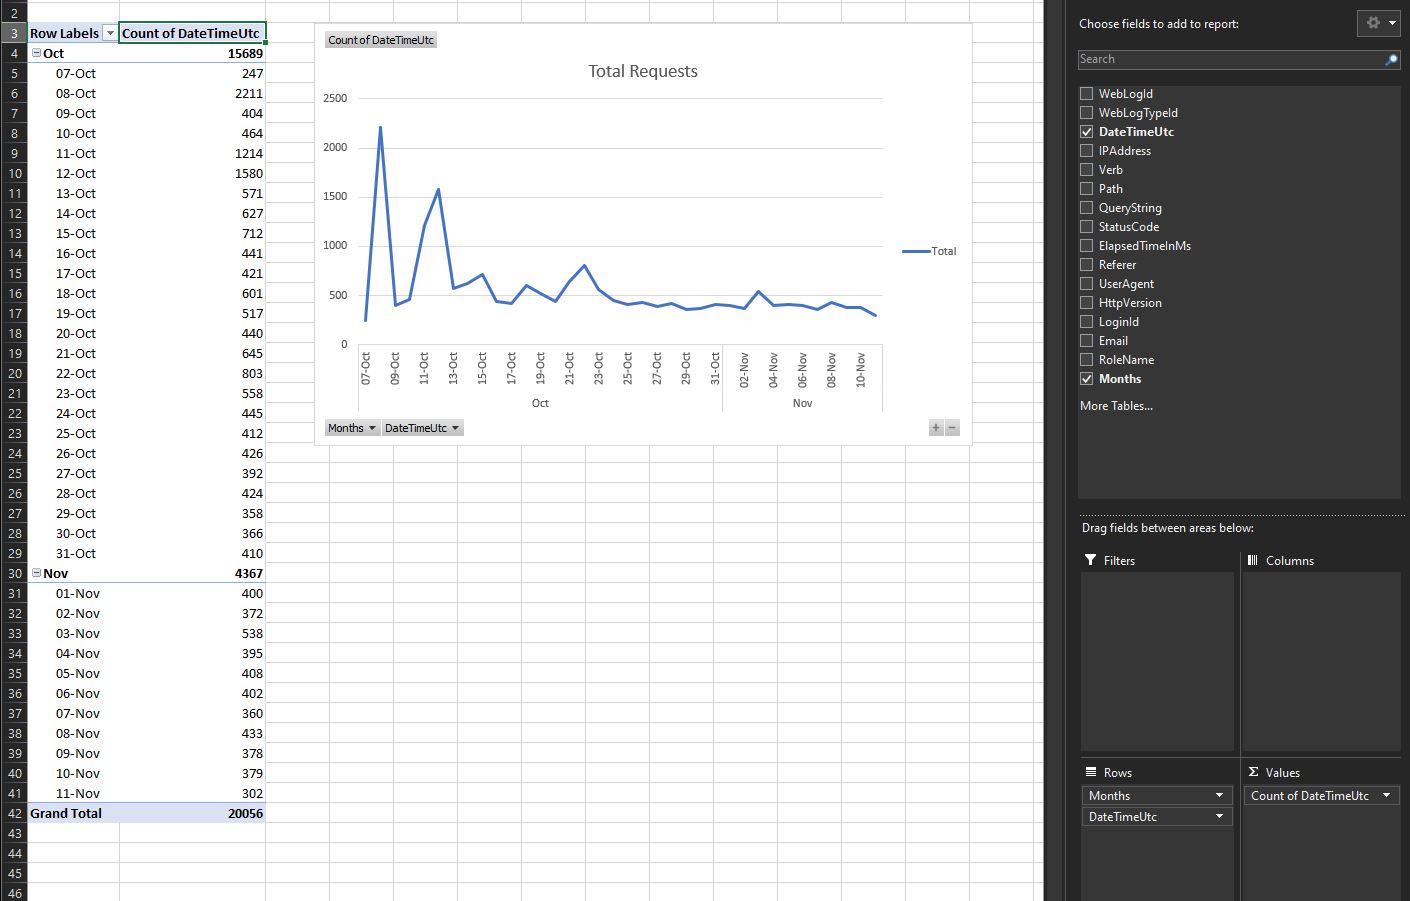
Total Requests
Alt H O I auto format column widths
In Excel Table, Table Design, Summerize with PivotTable, New Worksheet
Pivot table: RequestsPivot Worksheet: Requests Pivot
Months field has been created for us.
Refreshing Data
Data, Refresh All
I have to press it twice - once to update data source, then to update PivotTables
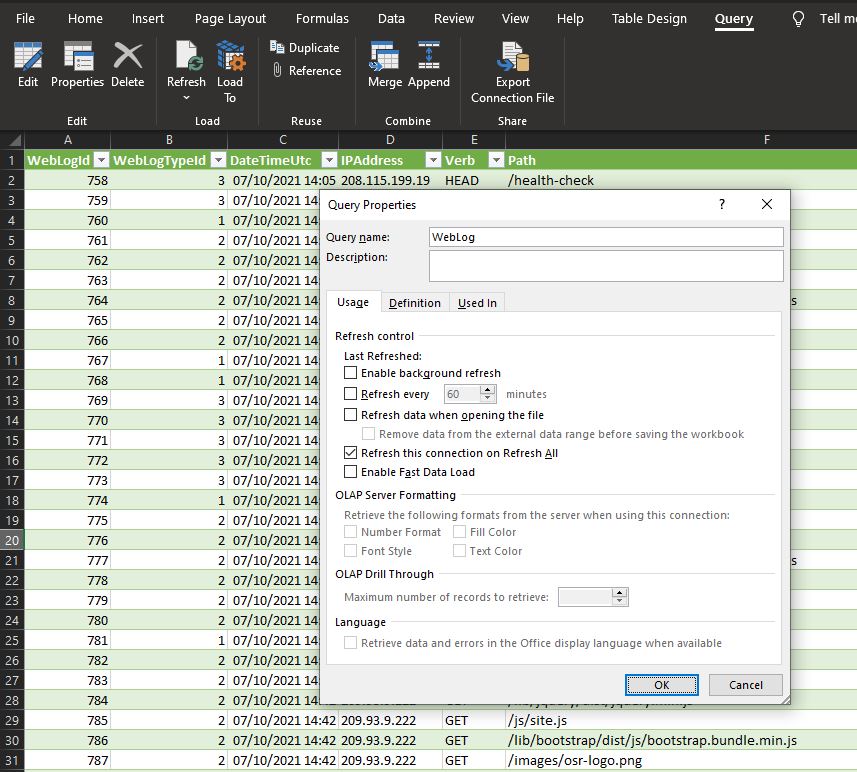
Untick enable background refresh - this means we have to only press refresh once now.
If I auto refresh the Data source every minute, it works. However the PivotTable and PivotChart don’t automatically update.
It works when I open the file, but not in real time from the data source which does update every minute.
https://www.excelcampus.com/vba/refresh-pivot-tables-automatically/ looks like a VBA macro is the way to do it.
My preference is now:
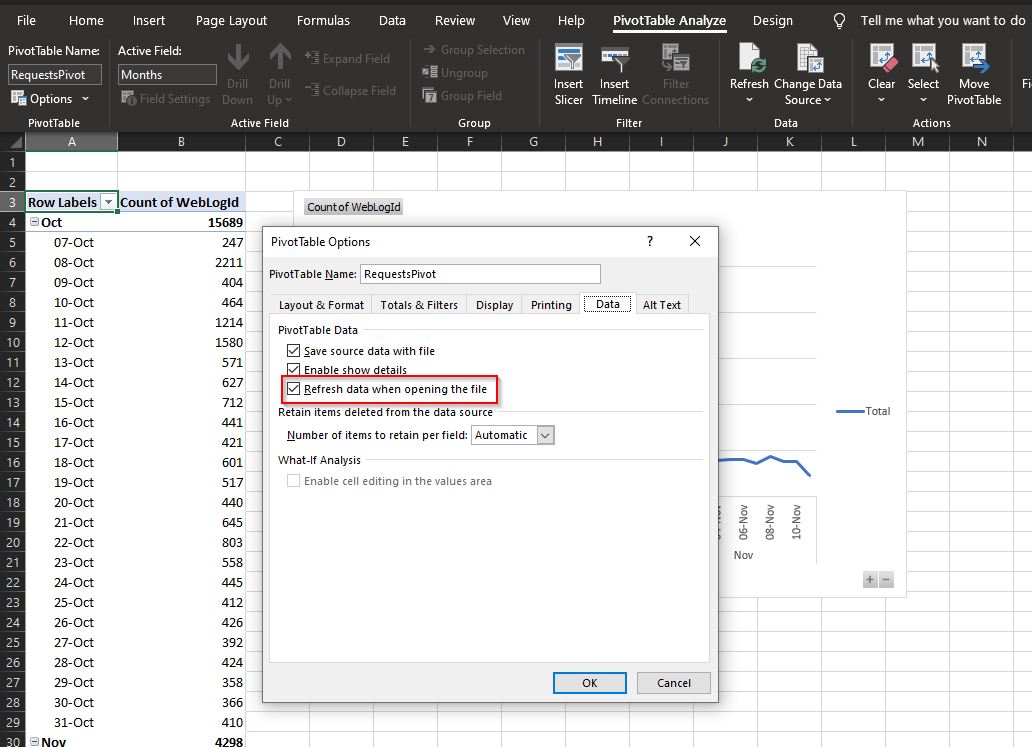
- PivotTable - refresh on file open
- Data source - refresh on file open, background update is off (so once only for press refresh)
Then I’m happy to press the Refresh All button.
Multiple Machines
As expected the connection url and db name are stored in the worksheet, but the username and password is not.
To run the dashboard on anohter machine, enter the username and password, and make sure the Azure SQL allows connections from that IP address (set Firewall Rule in Azure Portal).
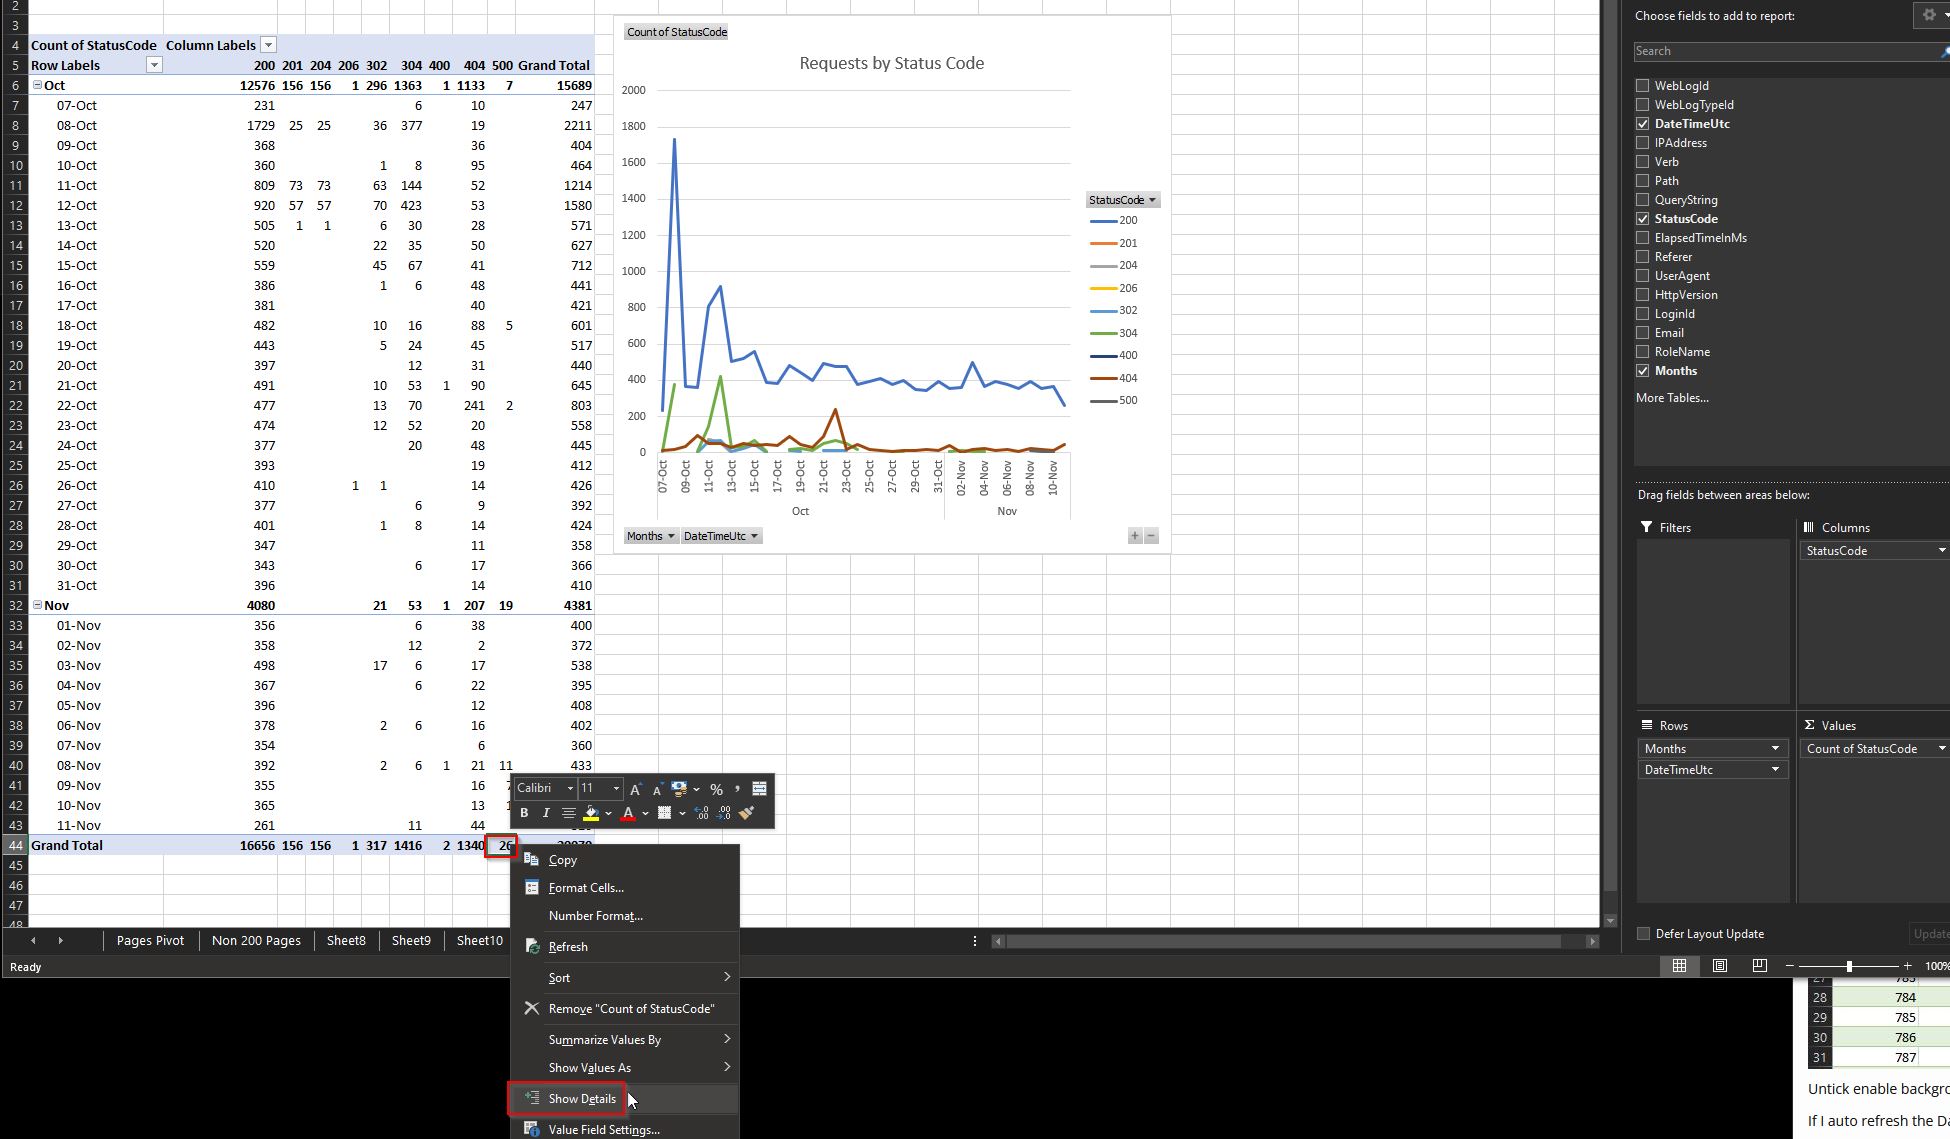
Requests by Time Pivot
On the Data Table worksheet, click Summerize with PivotTable in a new worksheet.
Ctrl z after dragging DateTimeUtc onto Rows to undo the default grouping.
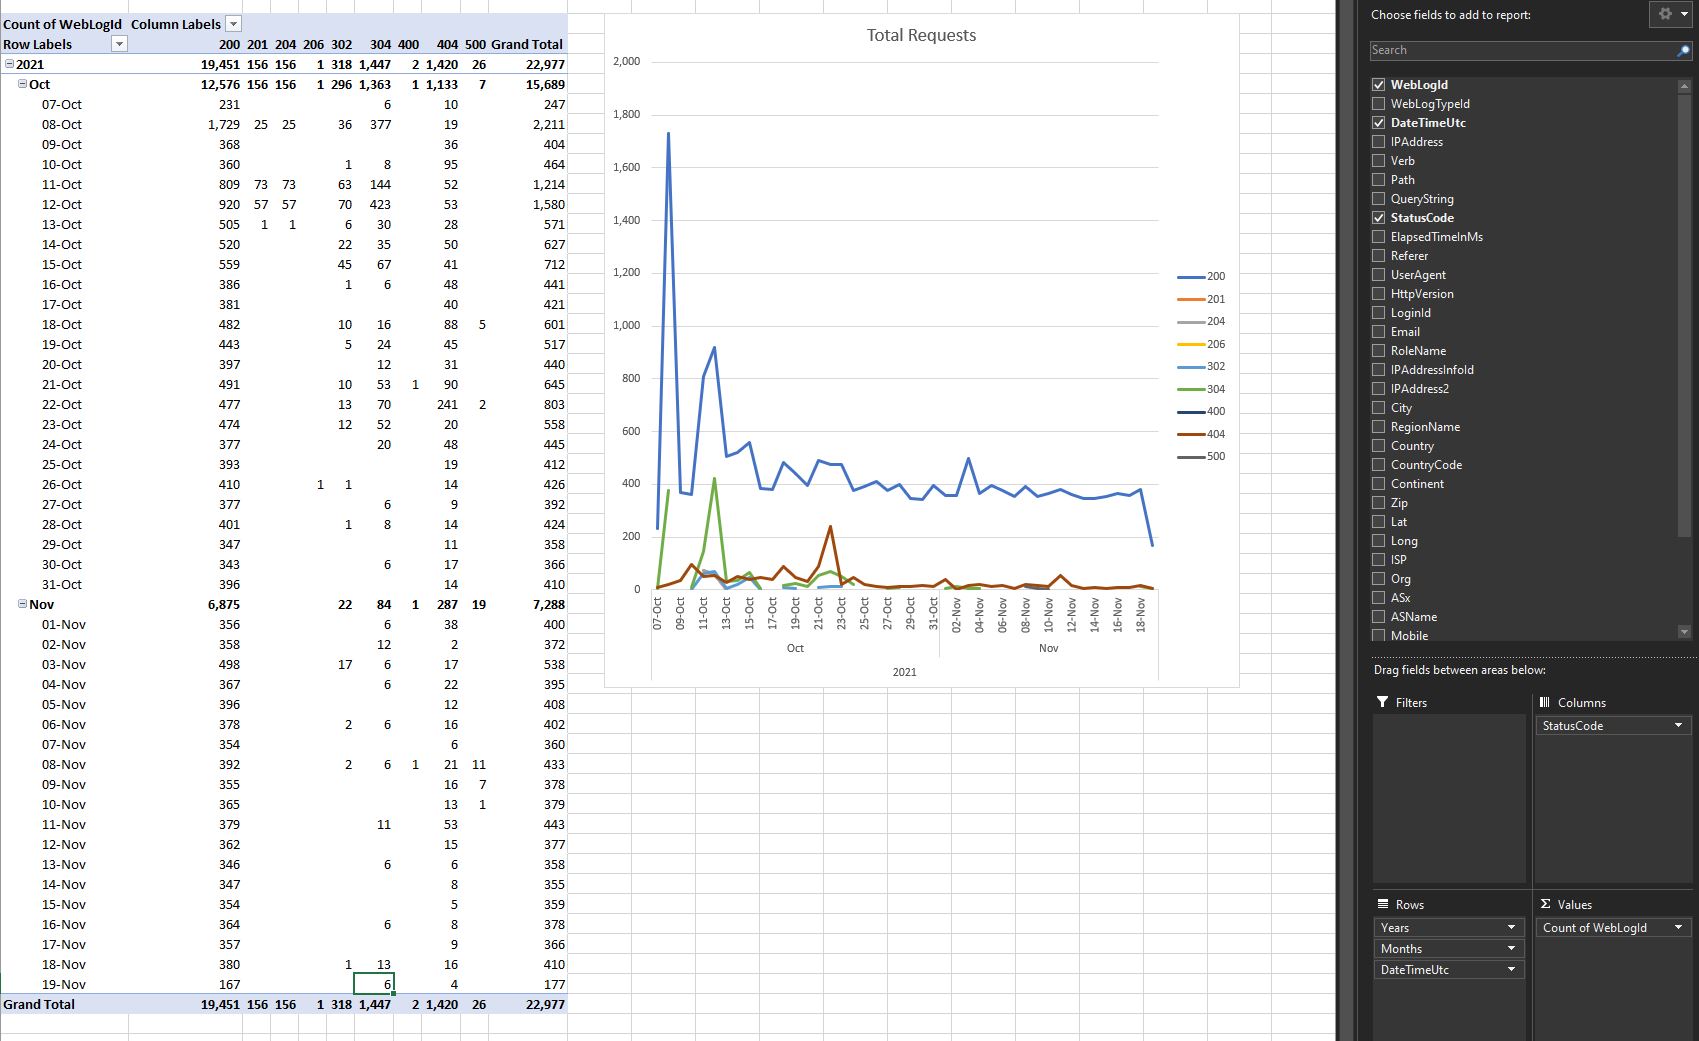
Group by Years, Months, Days.
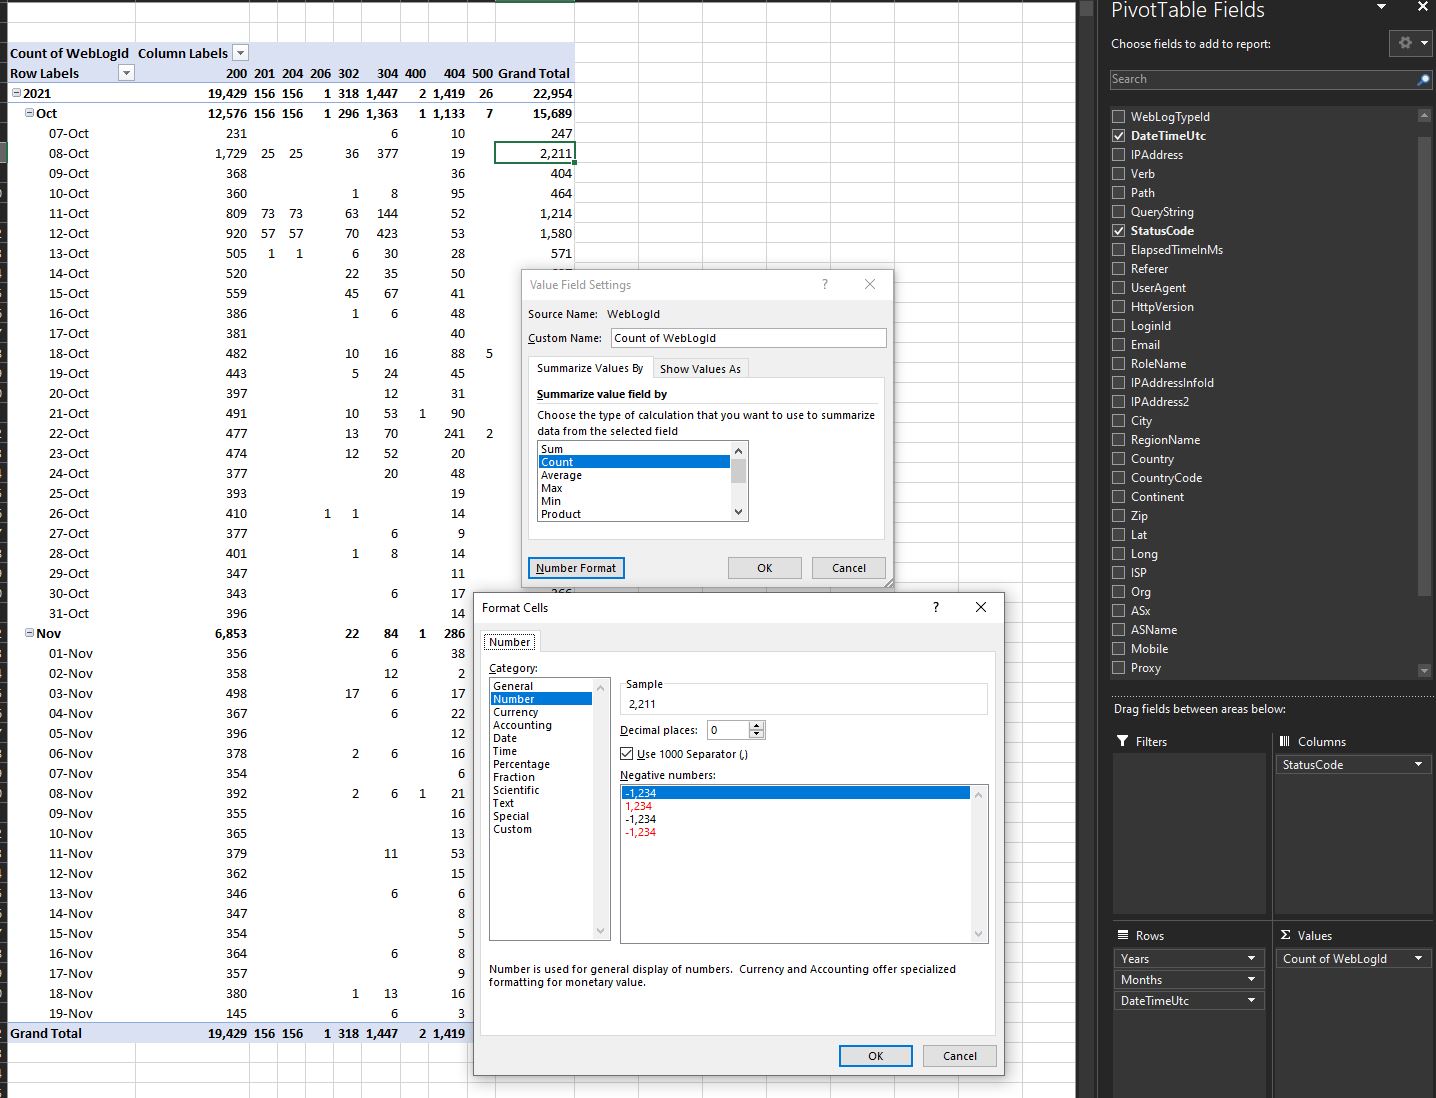
Set Number fields to use commas and no decimal places
PivotChart - Line.
Remove all field buttons (going to use slicers)
- Can see if any unusual spikes in total traffic
- Explore 500 errors to see if important
- 404 any problems
- 302’s (Redirect) are a sign that the app is being used
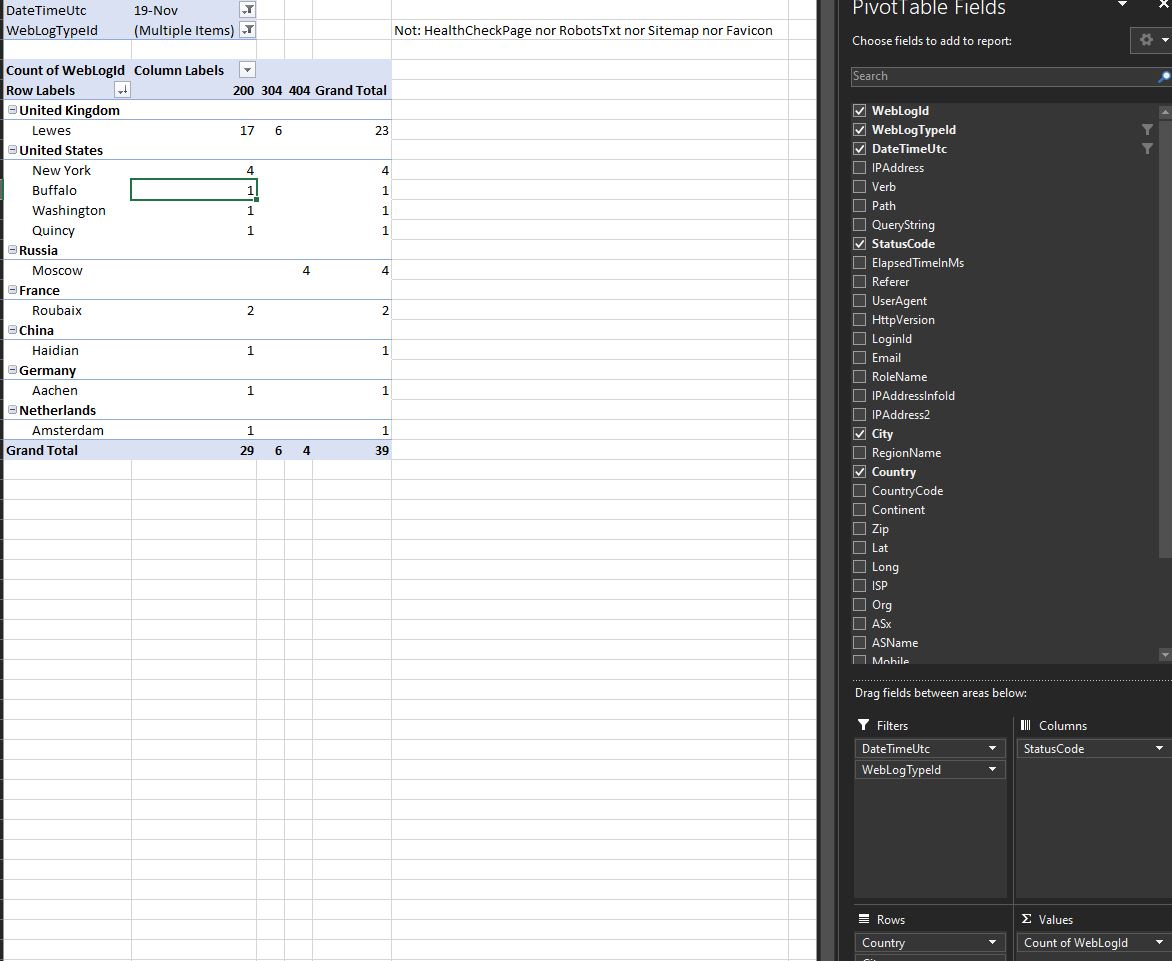
Daily by City
- Can see any new users having difficulties by location
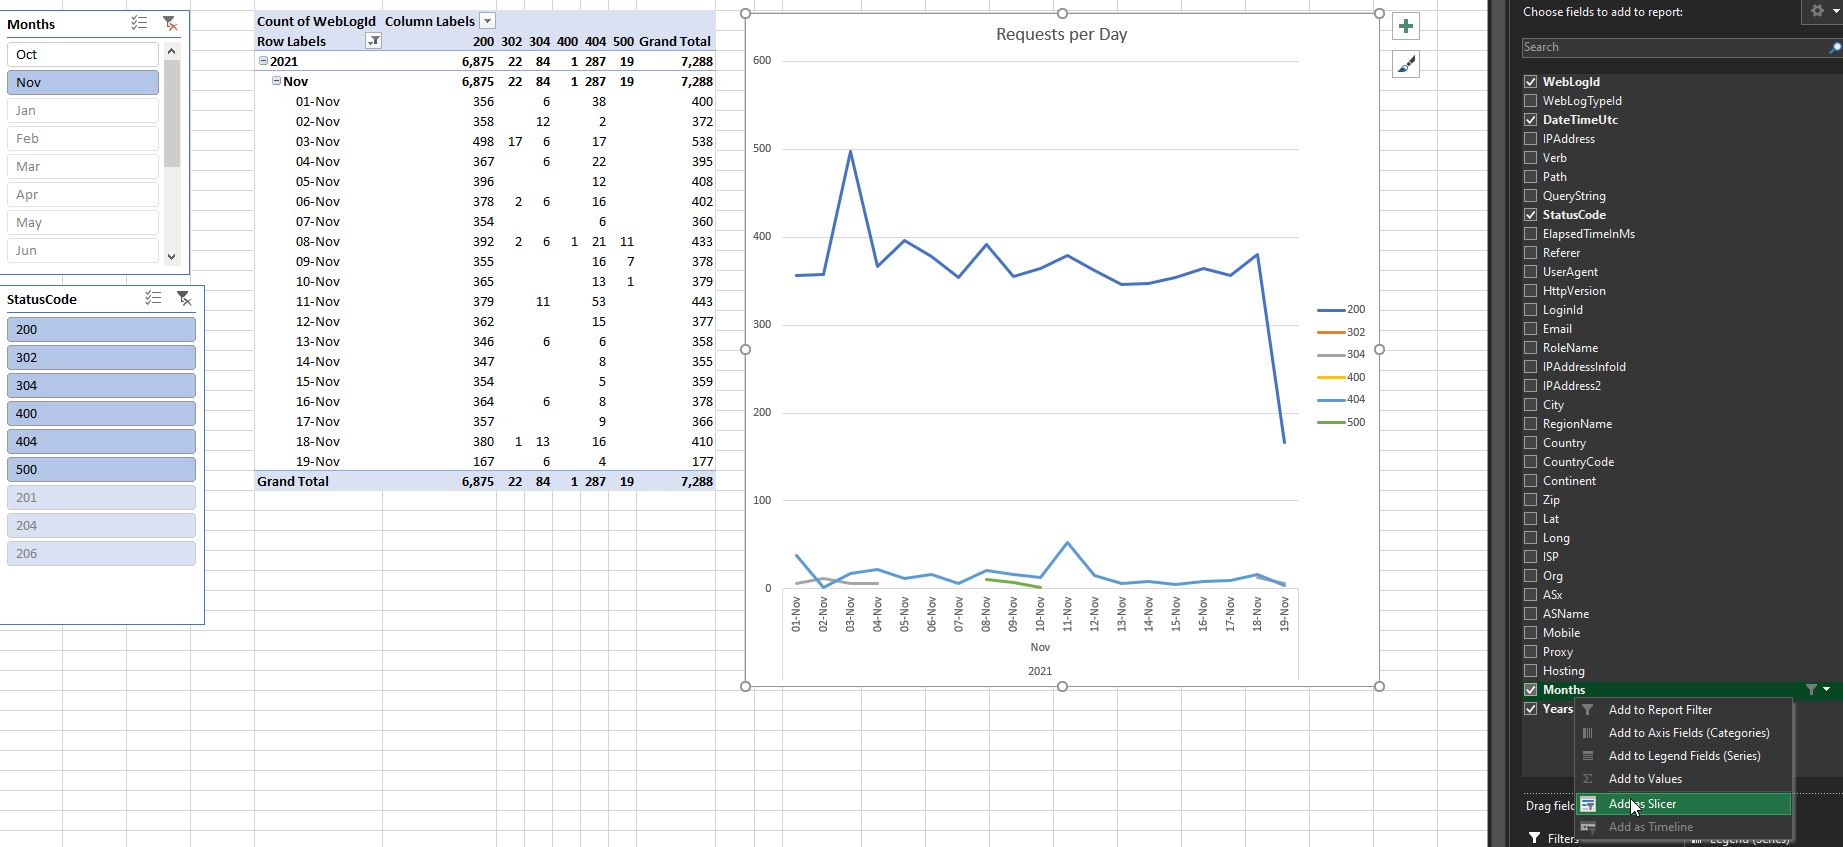
Slicers
- See just this months trending data
- Filter by status code to see more clearly the problems
To wire up slicer to more than 1 chart, right click on slicer, report connections, then select multiple charts.
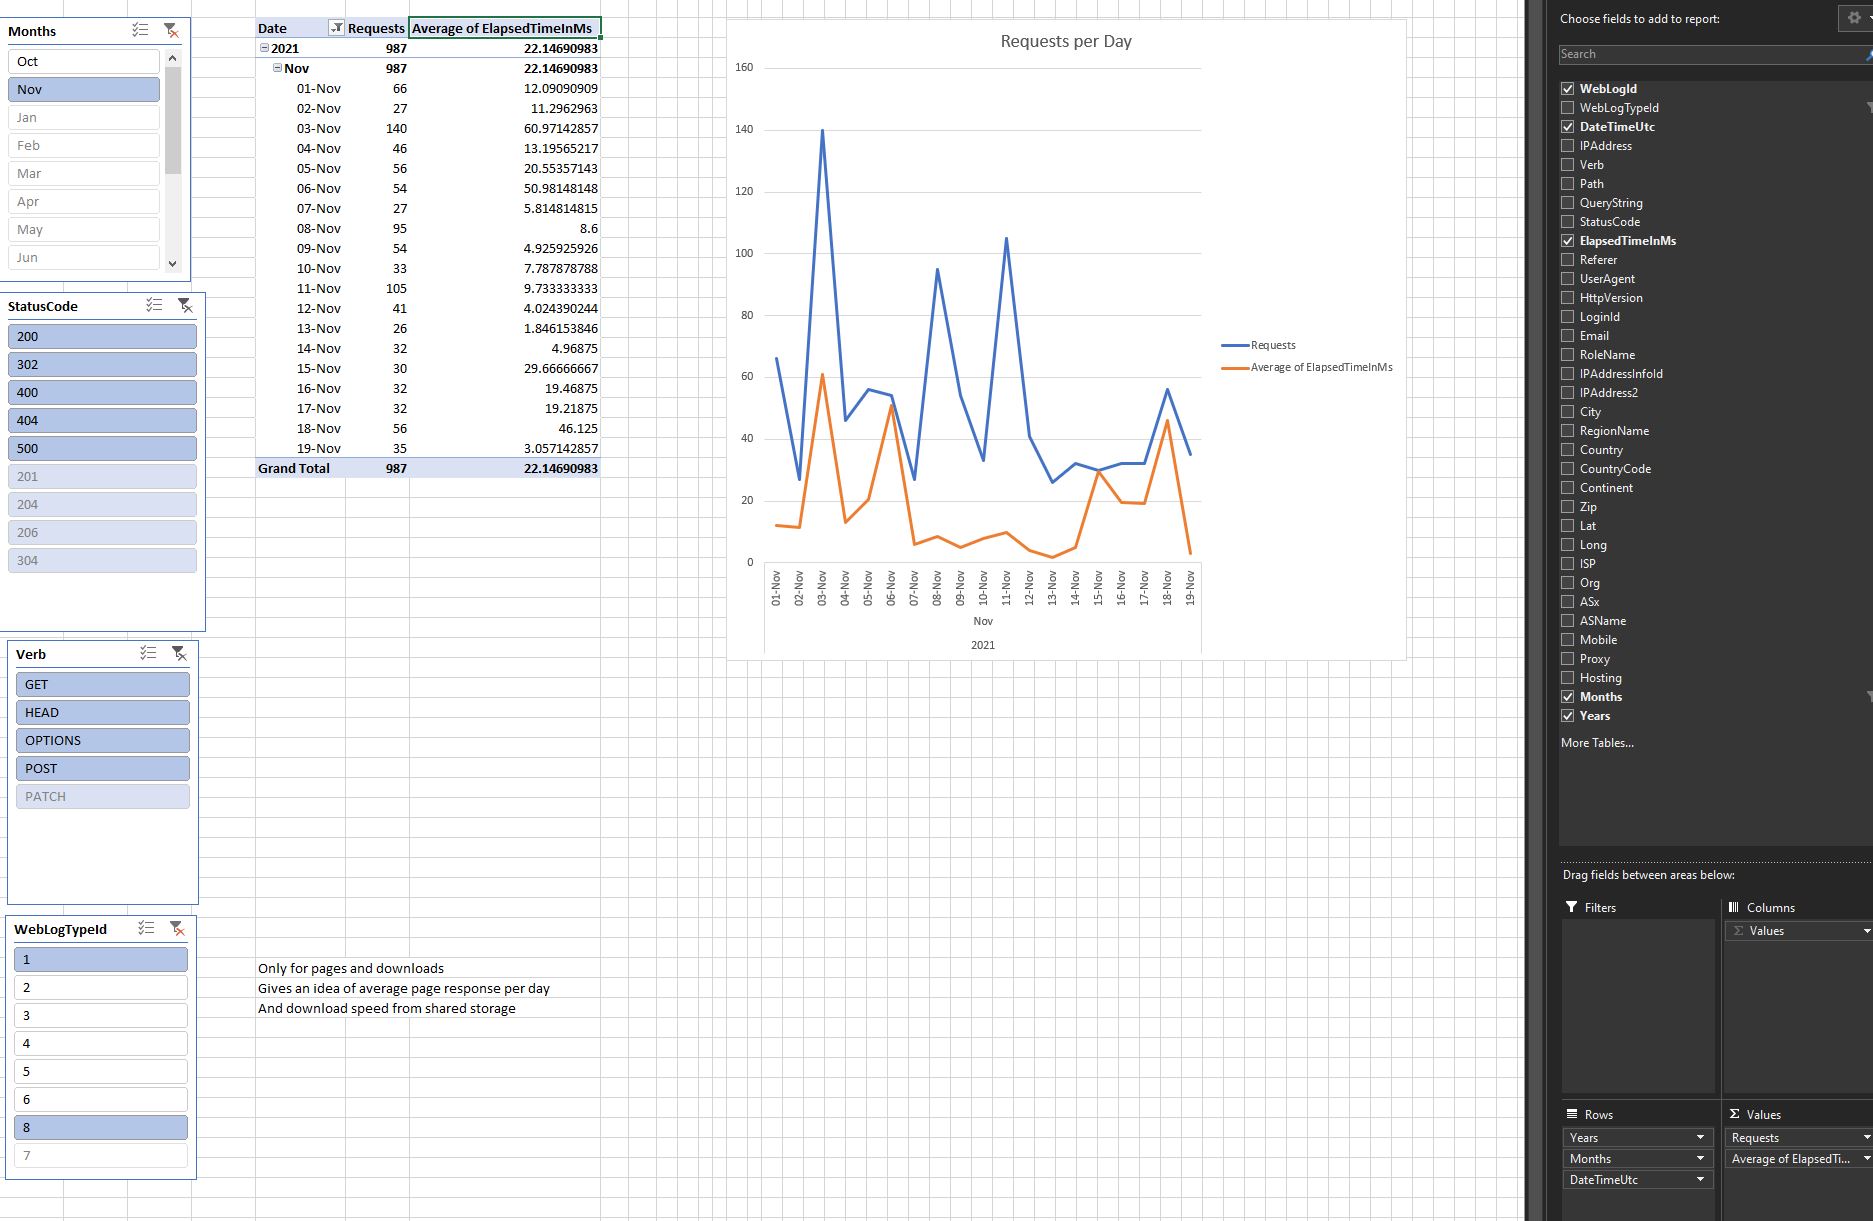
Average Request Time
- Performance of the webserver
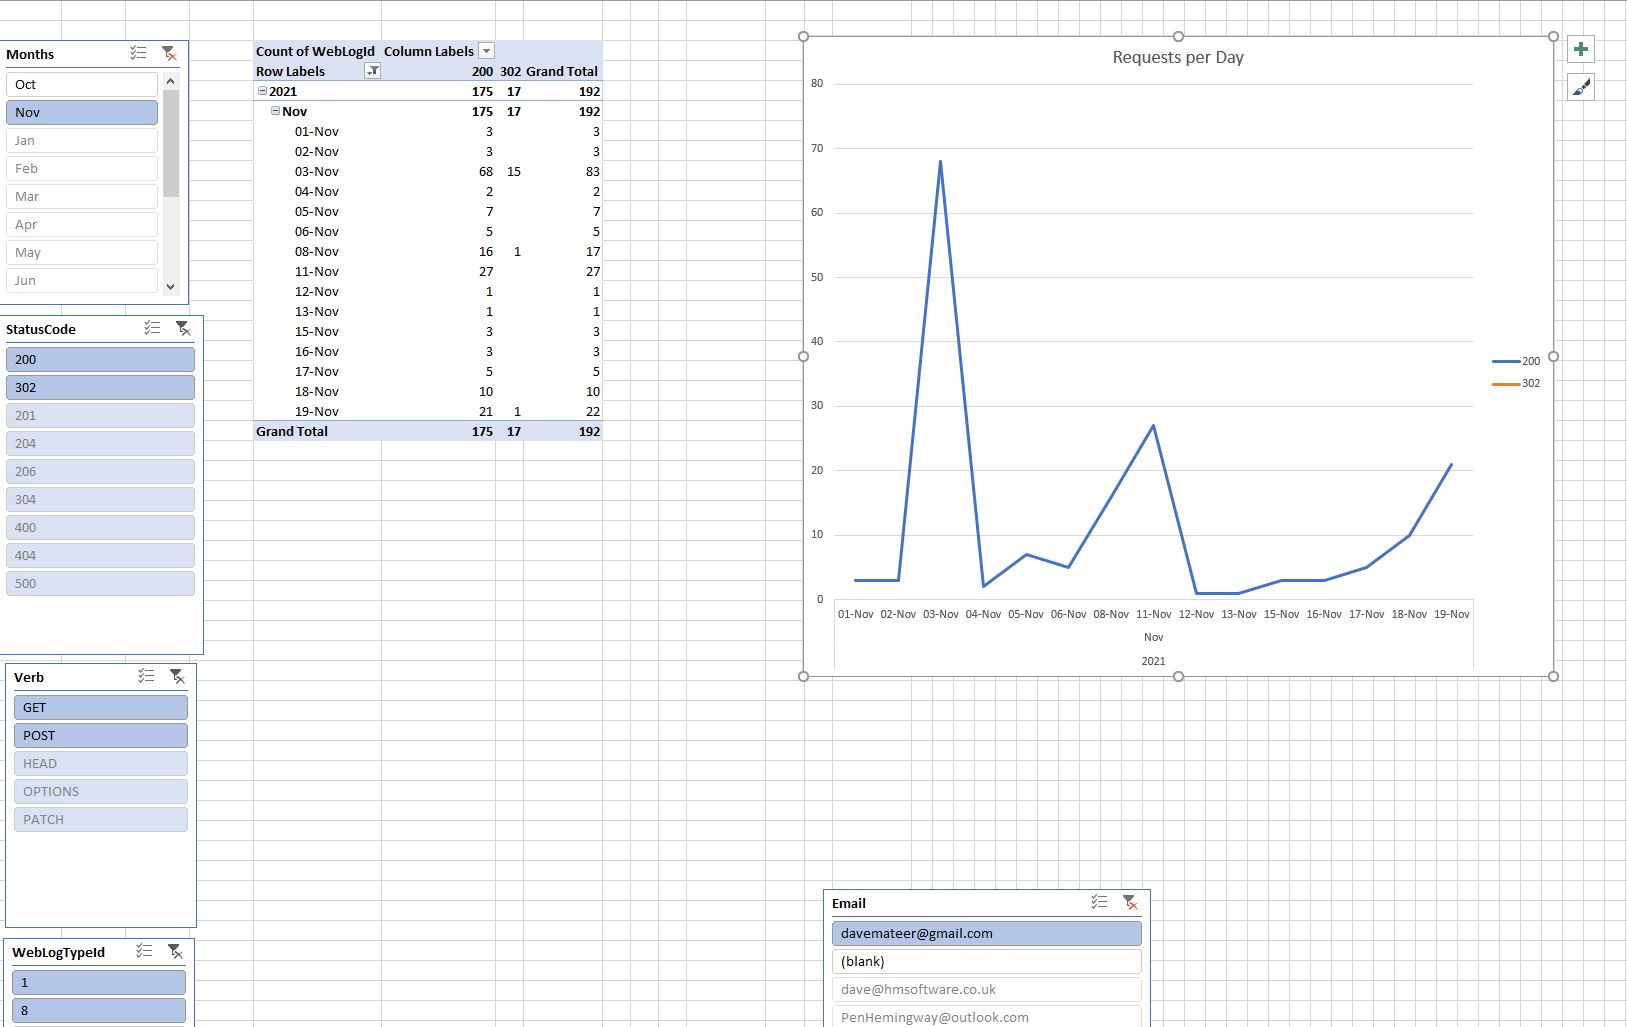
Users
- Explore what users of the system have been doing
This uses data now which is not in a normal webserver log
Hosting
Save to OneDrive but it needs to be less than 25MB to view online
Can’t refresh data from the hosted file.
Can view graphs fine.
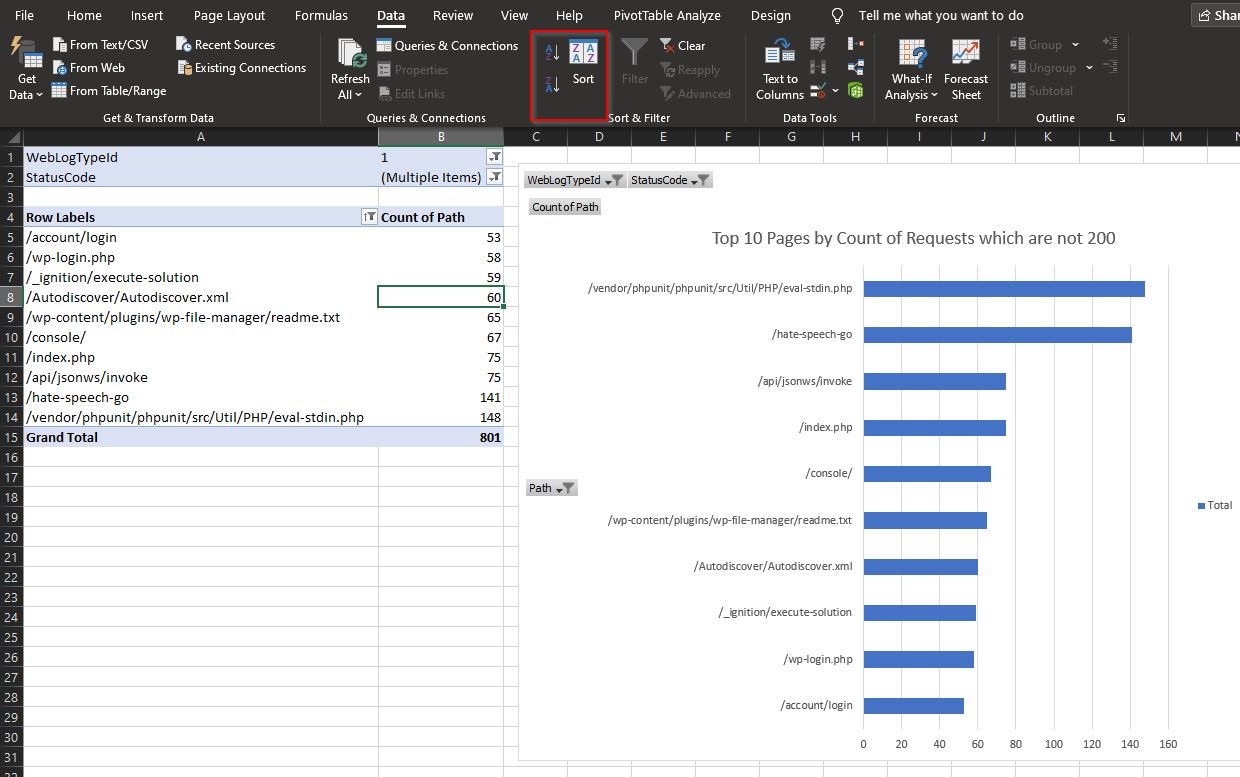
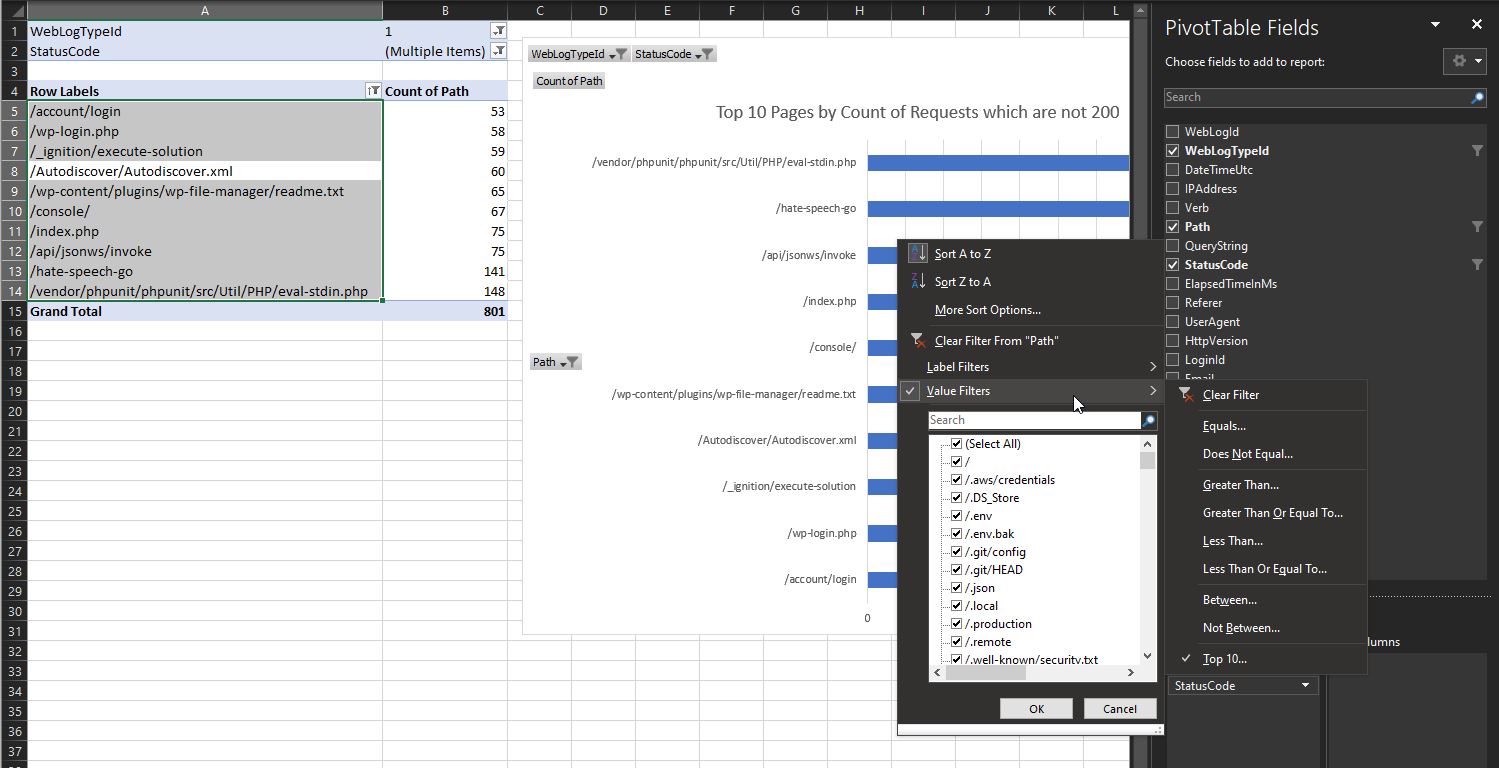
Top 10 Pages
Path, Value Filter, Top 10
Data source is from the live database
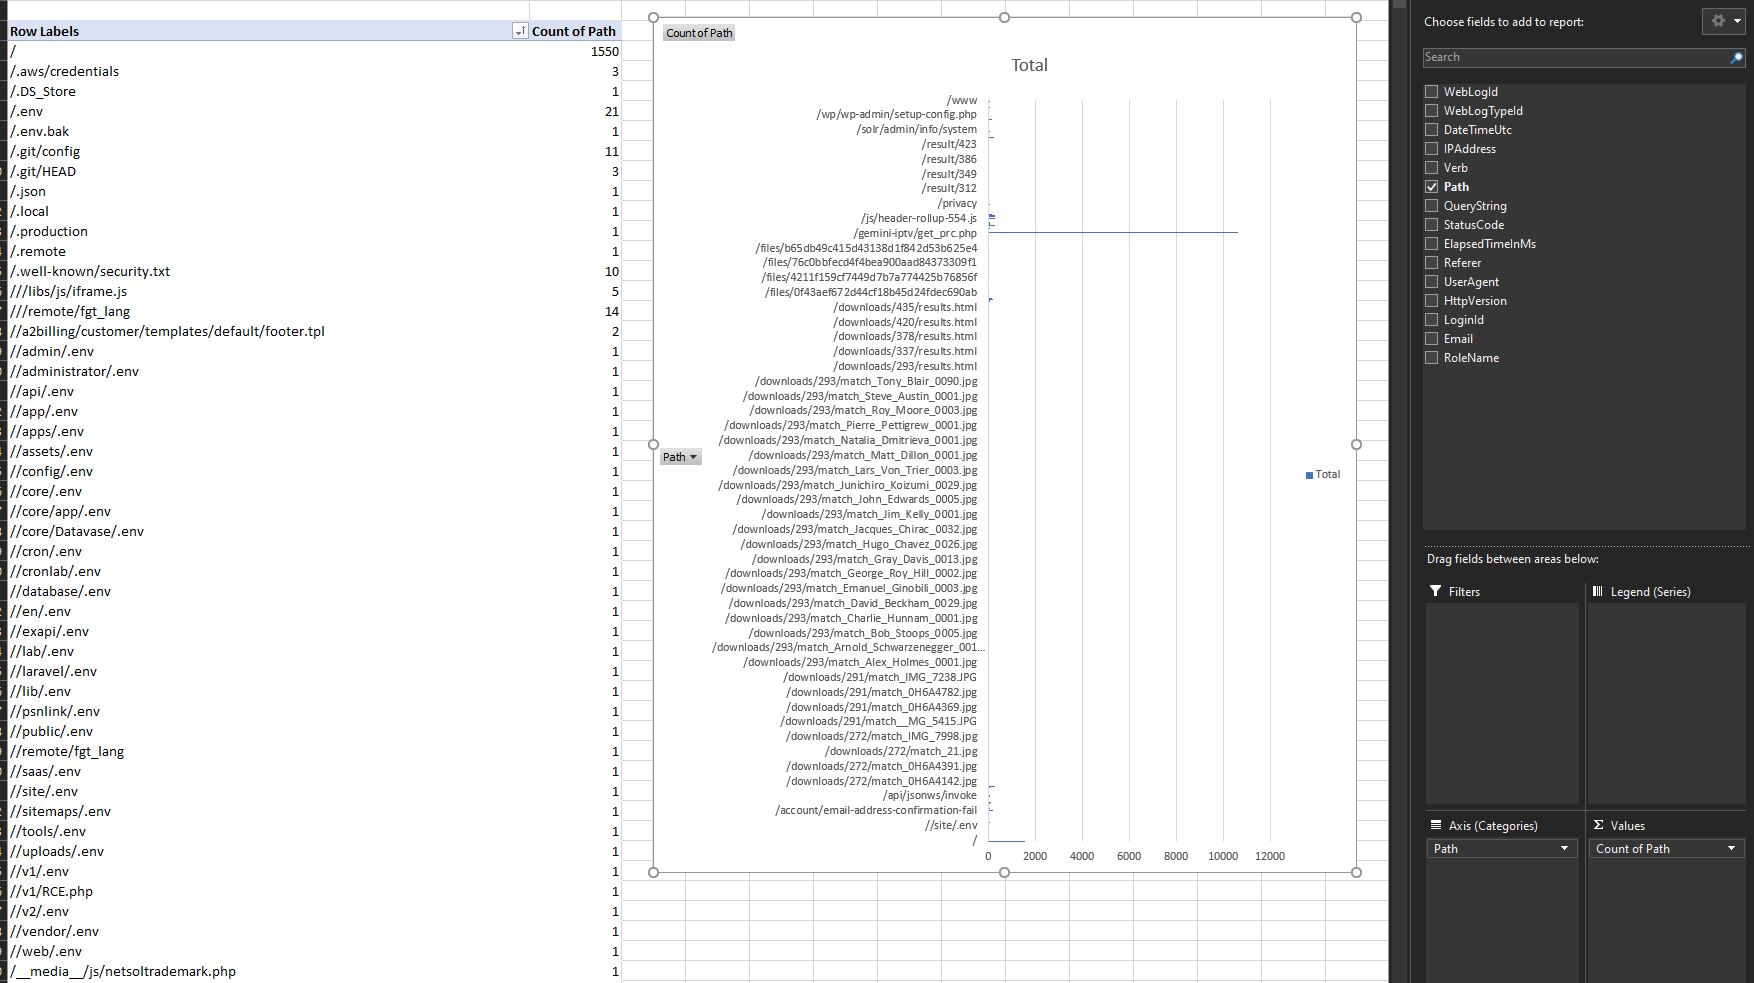
Am trying to sort on Count of WebLogId but can’t
https://www.contextures.com/excel-pivot-table-sorting.html gave me the clue
Sort the PivotTable and PivotChart
Value filter of top 10 only on Path.
Columns in Bar chart
What I’d like to do is drill into a day (eg yesterday) and see what that 500 error was.
Probably need a slicer, and a way to see the raw data
Exploring Data
Right click
Wow that is excellent - can even right click on subtotals
Setting up values manually
yyyy-mm-dd hh:mm:ss.000 worked for fractional dates for SQL Server DateTime.
Alt H O I auto format column widths
Ctrl T Format as an Excel Table.
Still can’t sort on the count column.
