R and Tidyverse Beginners guide
This article covers:
- What is R
- Tidying Data
- Charting
The next article covers Linear Regression
What is R
r-project.org is a programming language that implements statistics and graphical techniques
R is an implmentation of S combined with semantics inspired by Scheme.
- 1976 - S was created
- 1991 - Uni Auckland, began an alternative implementation of S
- 1993 - R had first release - named for 2 authors Ross and Robert and a play on S
wikipedia.org on R_(programming_language)
Why use R / Who uses R
- Biology Scientists - analyse experimental data
- Data Scientists - wrangle data
I’ve noticed that people who know Python / C# (or a high level language) tend to use that for the wrangling
Pandas is a common Python library for wrangling
For storage if you’re comfortable with SQL often people store the data in Postgres / MySQL then chart with R. This means you can use SQL to get the data out of the db in the shape you want.
- Data Manipulation / Data Wrangling / Data Munging - transforming raw data into another formating with the intent of making it more appropriate. (Dplry package in Tidyverse) - pronounced dee plier
- Tidying data ie changing it. (tidyr packacke in Tidyverse)
- Visualising / making charts to publish papers in journals (ggplot2 in Tidyverse)
Alternatives to R include: Python (or any high level language but python is super popular for data science) Excel, SPSS, MatLab
Use R because it is
- Scriptable
- Free
- Powerful
- Popular
What does it do
- Data wrangling
- Data visualisation
implements a wide variety of stats and graphics techniques
- linear and non-linear modelling
- stats tests
- time series analysis
- classification
- clustering
What is Tidyverse
Tidyverse is an opinionated collection of R packages.
R and RStudio
Download the latest version of R from r-project.org - currently on 4.0.3 on 6th Nov 2020
Download RStudio - 1.3.1093 on 6th Nov 2020.
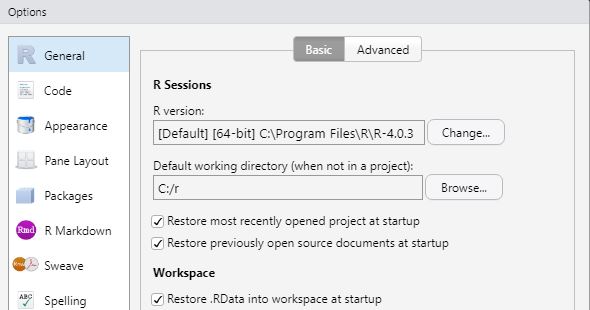
Tools, Global Options
I prefer to set my default directory to c:\r so when working on different machines there is no communcation except from raw R files projects which will be in Git. The default user directory for me was linked to my OneDrive.
Whilst here these are my preferences:
- General - working folder as c:\r
- Code, Soft wrap R files tick
- Code, vim keybindings
- Panel layout, Console in top right
- Packages, change CRAN mirror to UK (London)
- Appearance, Editor Theme, Pastel on Dark
- Appearance, Editor font, Consolas
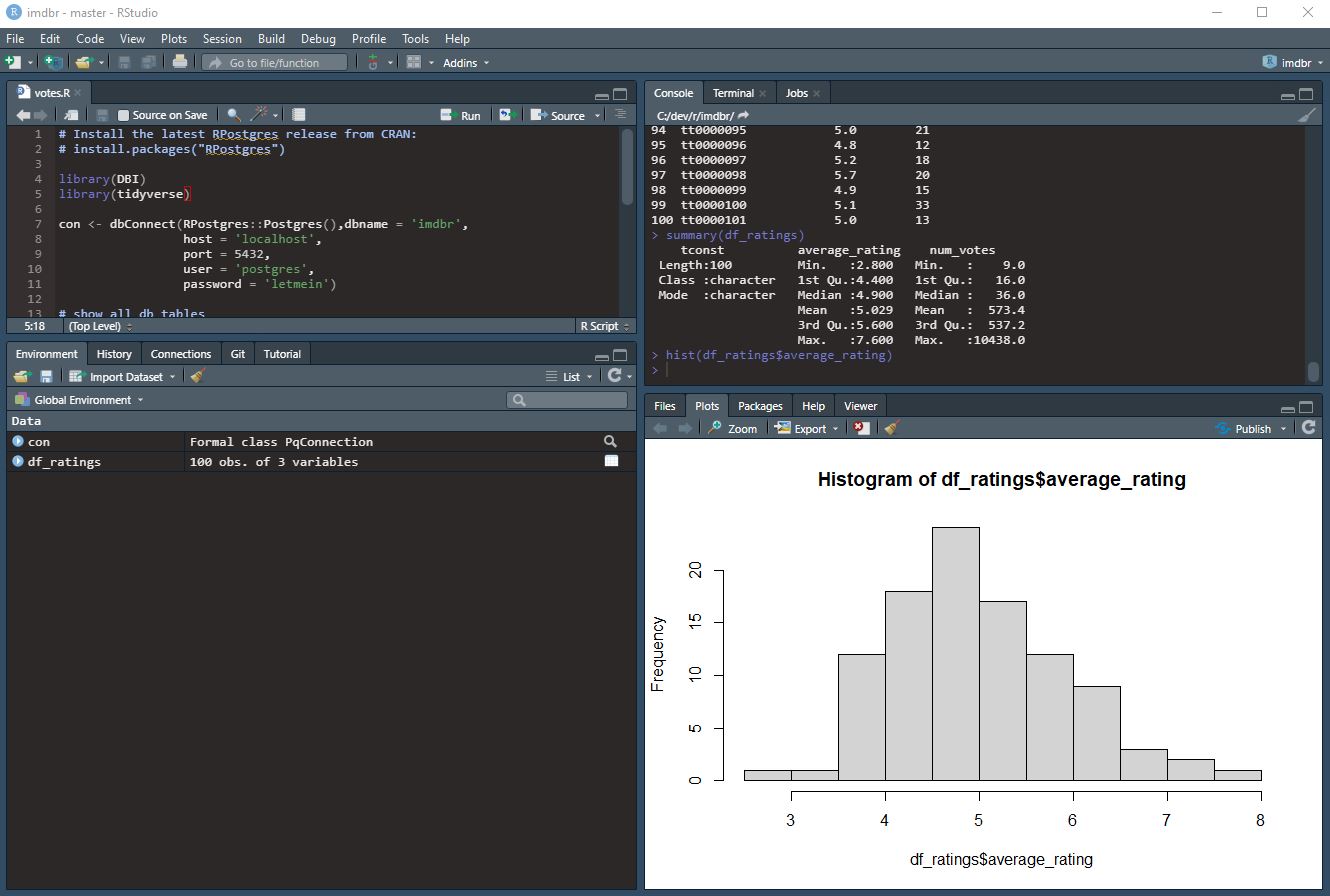
My preferred RStudio setup
R Packages
I change the .libPaths() folder to c:\r\library\
Update this setting in C:\Program Files\R\R-4.0.3\etc\Rprofile.site as
# my custom library path
.libPaths("C:/r/library")
By default is set to ~ and on my Windows machine this is a synced OneDrive folder. R creates a folder called R and installs libraries in there - 370MB of libraries and around 30,000 separate files.
# display the path
.libPaths()

install.packages("installr")
library(installer)
If you get an error:
“WARNING: Rtools is required to build R packages but is not currently installed. Please download and install the appropriate version of Rtools before proceeding:”

Then I solved this by installing RTools:
RTools
Download RTools if you get errors saying you need to install it (shown above)
# .Renviron in Documents folders
PATH="${RTOOLS40_HOME}\usr\bin;${PATH}"
Then install tidyverse using the dropdown: Tools, Install Packages, Tidyverse or do the install.packages command below
# install on local machine
install.packages("tidyverse")

# bring in the tidyverse libraries
library(tidyverse)

# or could just bring in
library(dplyr)
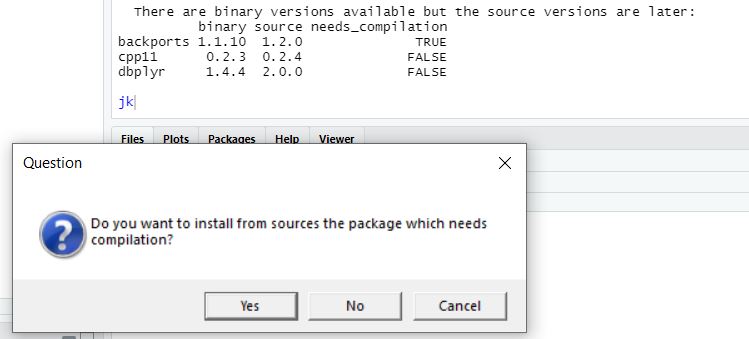
then

okay so we are good to go
R Studio Keyboard shortcuts
ctrl enter - run - This is by far my most used keyboard shortcut
ctrl shift c - comment / uncomment
ctrl shift m - pipe %>% aka magrittr
alt - assignment <-
R Useful code
# clear R of all objects
rm(list=ls())

# install package on local machine
install.packages("tidyverse")

# bring in tidyverse library
library(tidyverse)

# load in csv into a new dataframe using tidyverse's readr package
df_stuffcount <- read_csv("StuffCount.csv")

# Section 1 ####

# useful to print all the df
print.data.frame(.)
Pluralsight
Data Science with R by Matthew Renze
The goal (of data science) is to turn data into information, and information into insight
Carly Fiorina - former CEO of HP
Reading data
eg read_csv() read_log() - web log files
Also lots of other sources including: Postgres, httr (Web API’s), rvest (web) however as a developer I’m going to stick to
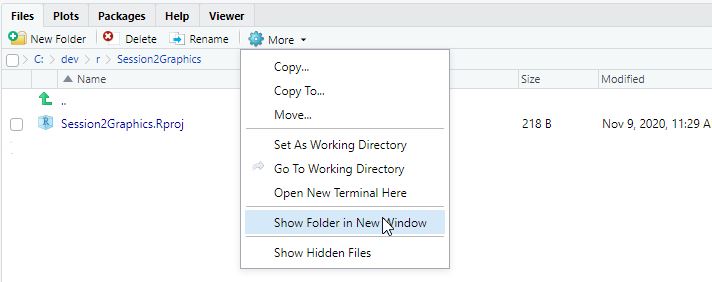
This is useful to open up a Windows Explorer window so can copy the file into the correct place.
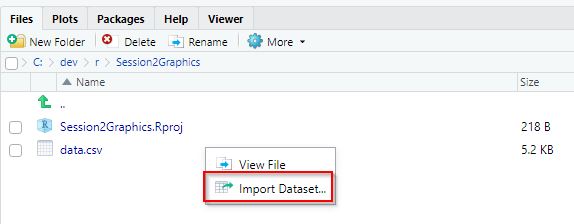
which lets me see the csv it is importing (like in Excel CSV import), then it generates the code to do it using readr.
library(readr)
data <- read_csv("data.csv")
View(data)
Wrangling data
Data Manipulation / Data Wrangling / Data Munging - transforming raw data into another formating with the intent of making it more appropriate.
dplyr pronounced - Dee plier
verbs
- filter - where
- arrange - sort / order by
- mutate - new column
more
- group by
- summerise - selecting group by data (always comes after a group by)
- join
- arrange (desc(Year))
Tidying data
Data Visualisation
10 Simple rules for Better Figures
# clear R of all objects
rm(list=ls())


# package tidyverse readr
library(readr)
# library(tidyverse)

df_stuff <- read_csv("stuff.csv")

# x rows (shows the tibble - types too)
df_stuff

print.data.frame(df_stuff)

# select / mssql style data viewer
View(df_stuff)

# view a histogram of the vector (array of dbl's)
# this part of base R and not tidyverse
hist(df_stuff$TREATMENT)
R for a C# Application Buidler
log file analysis server log analysis web scraping library?
I suspect the real benefit for people like me who know a General Purpose Language like C# and SQL, is that R can do easy good stats analysis, and show the data.
Postgres
RPostgres is more up to date and has more GH stars, and may be slightly faster than RPostgreSQL
DBI defines R’s interfaces to databases. RPostgres implements this spec.
Here is some sample code:
# Install the latest RPostgres release from CRAN:
# install.packages("RPostgres")

library(DBI)
library(tidyverse)

con <- dbConnect(RPostgres::Postgres(),dbname = 'imdbr',
                 host = 'localhost',
                 port = 5432,
                 user = 'postgres',
                 password = 'letmein')

# show all db tables
dbListTables(con)

# get entire table
dbReadTable(con, "rating")

# send and fetch
res <- dbSendQuery(con, "SELECT * FROM rating limit 100")
dbFetch(res)

# does send and fetch together - handy
df_ratings <- dbGetQuery(con, "SELECT * FROM rating limit 100")
df_ratings

summary(df_ratings)

hist(df_ratings$average_rating)
Analysing data
It’s very important to understand the raw data and what it actually means.
-
Excel to view raw data, then export to csv
-
csv_import - does it work, and are the types it infers okay eg chr, dbl
-
summary(dataframe) to find the max,min, types
-
View(dataframe) and sorting - move view to different Quadrant to see the max / min / obvious errors eg NA null parts too
-
Histogram of each variable to check for outliers and distribution (does it make sense)
Correcting data errors
I would usually do it in Excel or a higher level language. Especially regarding whitespace, null and spurious non expected characters
# find the error
# it is row 94 that has ALTITUDE 2960 instead of 296
TLD %>%
  # this just puts in a row number
  rownames_to_column() %>%
  filter(ALTITUDE > 1500)

# 195 rows
summary(TLD)
TLD

# can now fix with indexing
TLD[94,5] <- 296

# or more functional using tidyverse
TLD <- TLD %>%
  mutate(ALTITUDE = if_else(ALTITUDE == 2960, 296, ALTITUDE))

# OR
TLD$ALTITUDE <- recode(TLD$ALTITUDE, `2960` = 296)
Transforming data
Because the raw data (and more importantly their residuals) may be skewed… so we can transform into a more normal (bell?) manner.
We want an normal distribution of data so can run standard types of analysis on it
Ggplot
Type of Charts
Visualise the data
- Histogram (used to show distribution of variables eg Altitude)
Very useful to see mistakes in the data eg Altitude of >1300m in the UK
- Bar charts (used to compare variables)
Terms
- R - language
-
R Studio - IDE
-
base R - no use of Tidyverse
- Tidyverse
- Dpylry - for wrangling data
- Tidyr - tidying data
- Ggplot2
- Data Structures
- Data frame - columns can be different types. eg like a table
- Vector - 1d array
- Matrix - 2d array
- Array
For experimentation we have fixed factors (eg experiment type) and measurements
- Variables - a measurement
-
Factor / Fixed Factor of the experiment eg a Treatment can be 1, 2 or 3 only
-
zero inflation - an excess of 0 data
- Gaussian (normal) distribution of data - bell curve
- Right skewed data (more data distributed to the left, so graph is skewed to the right ) of the histogram