Bashtop Linux resource monitor - alternative to Windows Task Manager

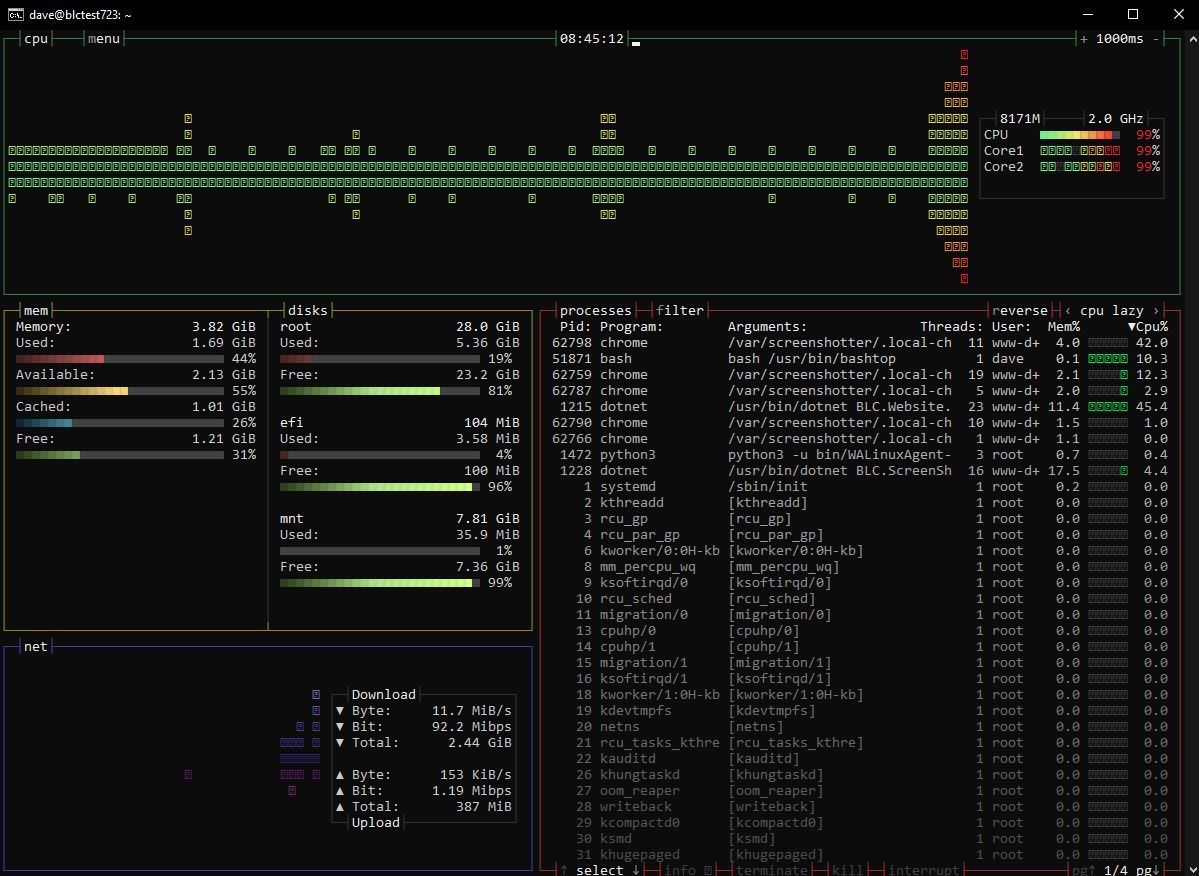
Bashtop is a very handy resource monitor for Linux. I’m using it from the cmd shell on Win 10, as cmder my shell of choice has rendering problems connected to Ubuntu 18.04 LTS on an Azure VM, and have installed it using azlux’s open source repository
echo "deb http://packages.azlux.fr/debian/ buster main" | sudo tee /etc/apt/sources.list.d/azlux.list
wget -qO - https://azlux.fr/repo.gpg.key | sudo apt-key add -

sudo apt update
sudo apt install bashtop -y

bashtop
Useful shortcut keys are:
-
+Increase sample time (2500ms is about right for me) -
-Decrease sample time (500ms is great but uses a lot of resources!) -
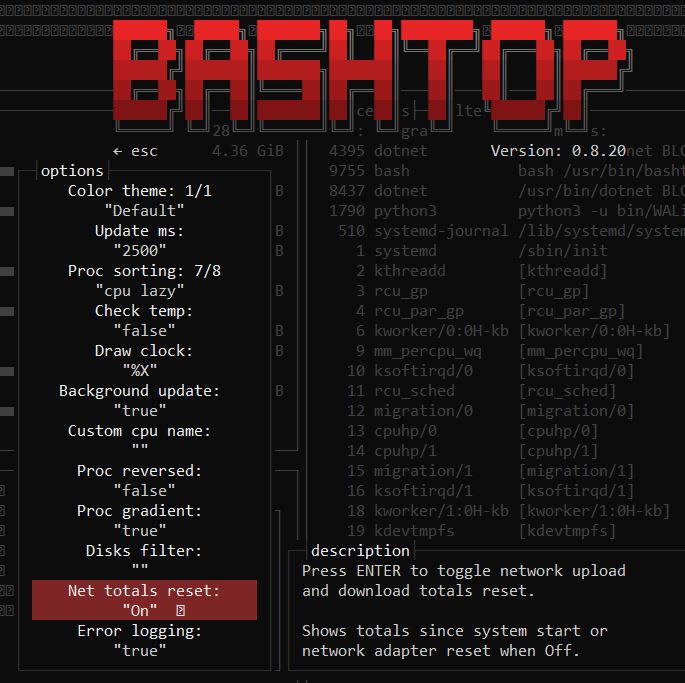
ESCShow Options and Help -
f- filter process names -
Up/Down- select a process -
Enter- see more details on a process

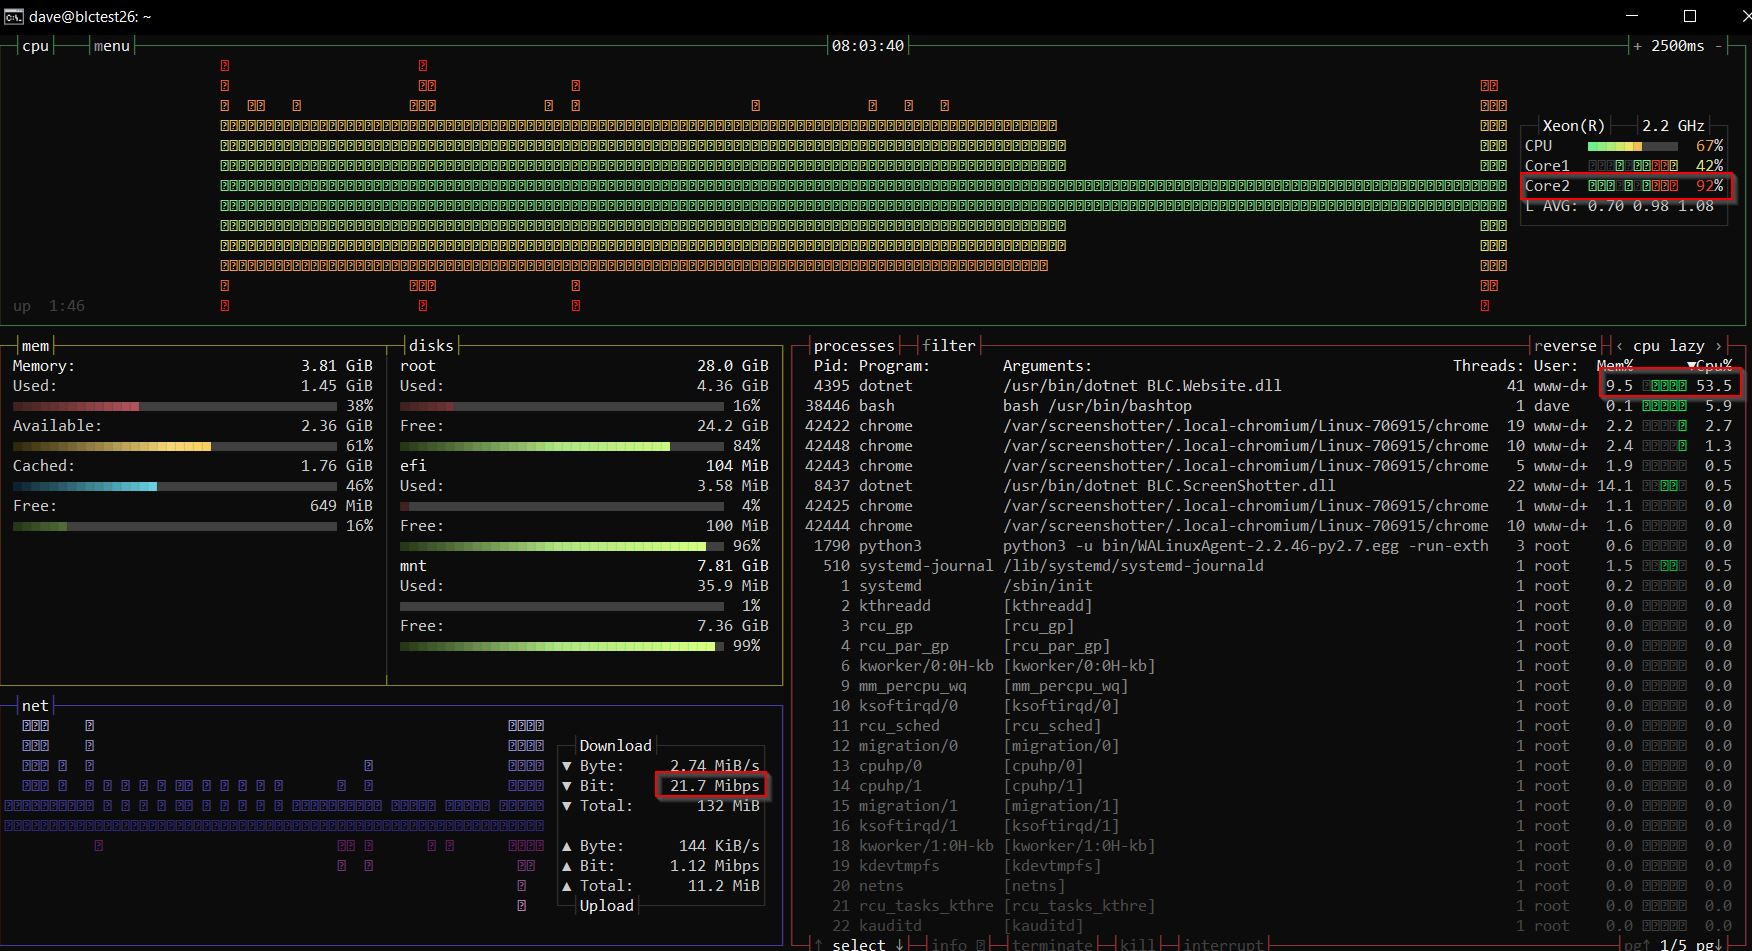
Looking at current inbound traffic for my broken link checker - 21 Mbps
CPU usage is interesting here and I’m exploring why I’ve got 1 core 100% utilised, when ideally my code should use all resources. I’m not sure if the relative %age is a bug or feature. It is a feature!! Which can now be flipped to show per core %age - very useful feature from @aristocratos
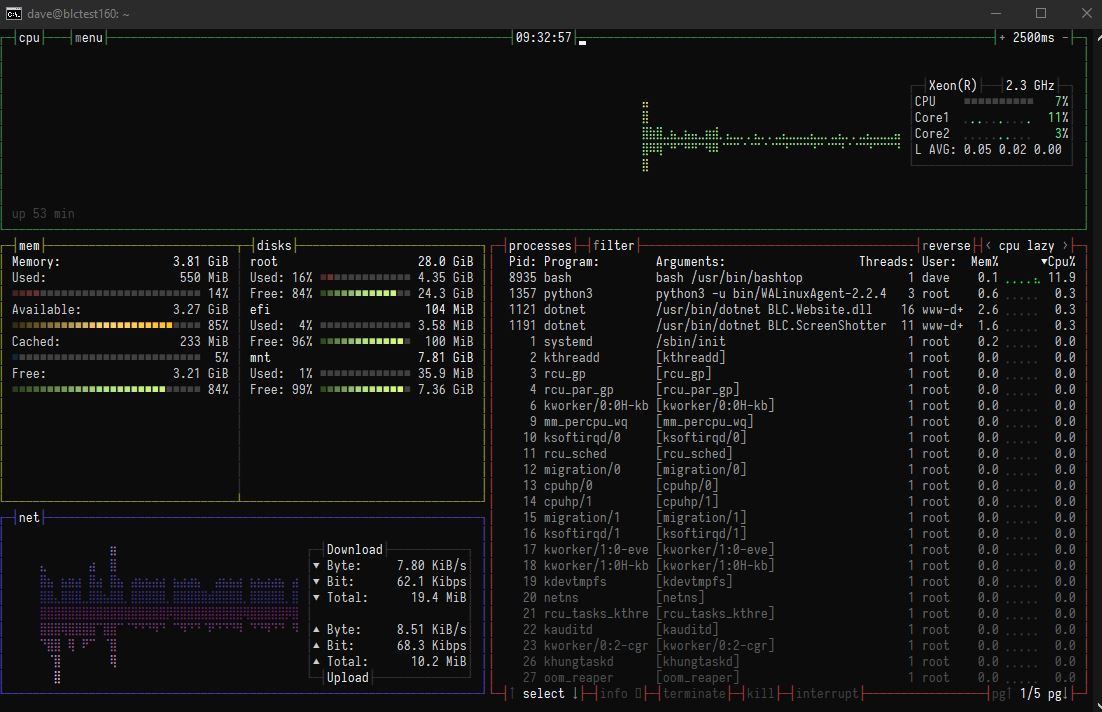
Using f - filter to filter the Web process I’m interested in. I prefer the non filtered screen to give an overview of the server.
To reset the Total Upload and Download counts, aristocratos kindly added this feature, which you can do from the options menu press ESC to get there.

Fonts
If you have squares in your graphs like I do try this fix to get the correct fonts which will then look much prettier:

Conclusion
As a quick overview on the server this is invaluable!
If you like it consider sponsoring https://github.com/aristocratos. Or a single paypal donate or a ko-fi coffee.