Making applications faster using MiniProfiler
Update 14th Oct 2020
This article on Dapper has my updated thinking on MiniProfiler along with a Working MPActors repository
Introduction
Performance is an essential part of any business application.
Badly perfoming software generally doesn’t deliver its intended benefits to an organisation and is frustrating which leads to user’s mistakes. It usually costs more to maintain due to it being slow to develop/test/deploy.
MiniProfiler is one of the tools I use to continually measure performance. Over the last 2 years, every application I have written (and had to work on) has had MiniProfiler in it at some stage.
What is good performance? Ask the people who use your system. In my experience users will tell you with brutal honesty what they think. There is a lot of research too.
What is MiniProfiler
- MiniProfiler can show how long database queries take (commonly the bottleneck in my applications)
- Can show API calls, AJAX Calls, Controller and View render times
- ASP.NET MVC / Webforms
- Can be used in Development and Production (has good security)

Miniprofiler overlays query times on any webpage. Here is a page showing 2 SQL queries which took 25.9ms to run.
Here is a book example using MiniProfiler
How to install MiniProfiler
Follow the instructions: here
- Install the Nuget package MiniProfiler
- Put css and javascript references at top and bottom in \Views\Shared_Layout.cshtml
- Put a call in Global.asax.cs to start and end the profiler
- Add a line in the root web.config system.webServer handler
How to do the database profiling bit
I generally have a Util.cs class in my Service/DAL namspace:
public static IDbConnection GetOpenConnection()
{
    var connection = new SqlConnection(ConfigurationManager.ConnectionStrings["ThinkBooksConnectionString"].ConnectionString);
    connection.Open();
    MiniProfiler.Settings.SqlFormatter = new StackExchange.Profiling.SqlFormatters.SqlServerFormatter();
    return new ProfiledDbConnection(connection, MiniProfiler.Current);
}
then
using (var db = Util.GetOpenConnection())
{
    return db.Query<Book>("SELECT TOP 10 * FROM Book").ToList();
}
Now let me show you the 5 things that I like about MP
1. Improving Query Times
By far my biggest use of MiniProfiler is tuning SQL queries. Here is an example of a home page (always a good place to start looking at where to start optimising) query which took 160ms to run a search.
SELECT * FROM Author
WHERE (@AuthorID IS NULL OR AuthorID = @AuthorID)
AND (@FirstName IS NULL OR FirstName LIKE CONCAT(@FirstName,'%'))
AND (@LastName IS NULL OR LastName LIKE '%' + @LastName + '%')
AND (@DateOfBirth IS NULL OR DateOfBirth = @DateOfBirth)
ORDER BY " + sanitizedSortColumn + " " + sortDirection + @"
OFFSET " + offset + @" ROWS
FETCH NEXT " + numberOfResults + " ROWS ONLY";
The business didn’t need lastname searching to be %lastname%, just lastname%, so after changing that:
AND (@LastName IS NULL OR LastName LIKE CONCAT(@LastName,'%'))We can see the performance improvement immediately:
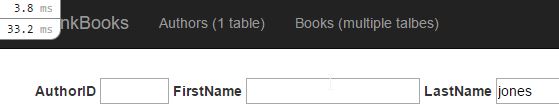
33ms query time now (from 160ms)
2. Duplicate queries
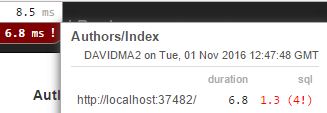
Another useful feature is highlighting if there are duplicate queries shown in red with a !
3. Seeing where ORM queries need to be replaced
Object Relational Mappers (ORMs) save developers time writing boilerplace CRUD SQL. Entity Framework and Dapper.Contrib are what I most commonly use.
For high performance screens (typically home screens, summary views of large datasets) it can be writing an abstraction on top of an abstraction.. why optimise LINQ when SQL gives you much more control?
MiniProfiler makes it continually obvious where the problems are, therefore allowing developers to switch to raw SQL in those places.
Here is a screen where using an ORM is asking for trouble
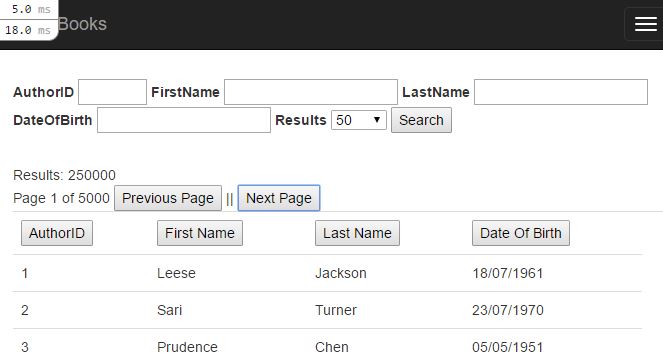
Filtering, Sorting and Paging. Also returning a count of total records. Difficult to get right in an ORM, and fine in SQL. Very fast performance (18ms).
4. N+1
If you have 50 Authors on the screen, and each has an AuthorStatusID which is Foreign Key’d to an AuthorStatus table:
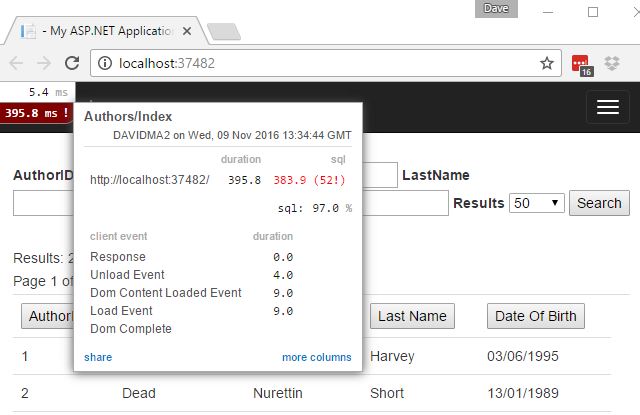
I have 50 Authors on the screen, and MiniProfiler is showing 52 queries, and showing as Duplicate queries. A huge red flag :-)
// Horrible way of getting the AuthorStatus eg Alive or Dead

foreach (var author in result)
{
    var authorStatusName = db.Query<string>("SELECT Name from AuthorStatus WHERE AuthorStatusID = @AuthorStatusID",
        new { author.AuthorStatusID }).FirstOrDefault();
    author.AuthorStatusName = authorStatusName;
}
Lets get the database to do the hard work:
var sql = @"
        SELECT a.*, s.Name AS AuthorStatusName FROM Author a
        INNER JOIN AuthorStatus s ON a.AuthorStatusID = s.AuthorStatusID
        WHERE (@AuthorID IS NULL OR AuthorID = @AuthorID)
        AND (@FirstName IS NULL OR FirstName LIKE CONCAT(@FirstName,'%'))
        AND (@LastName IS NULL OR LastName LIKE CONCAT(@LastName,'%'))
        AND (@DateOfBirth IS NULL OR DateOfBirth = @DateOfBirth)
        ORDER BY " + sanitizedSortColumn + " " + sortDirection + @"
        OFFSET " + offset + @" ROWS
        FETCH NEXT " + numberOfResults + " ROWS ONLY";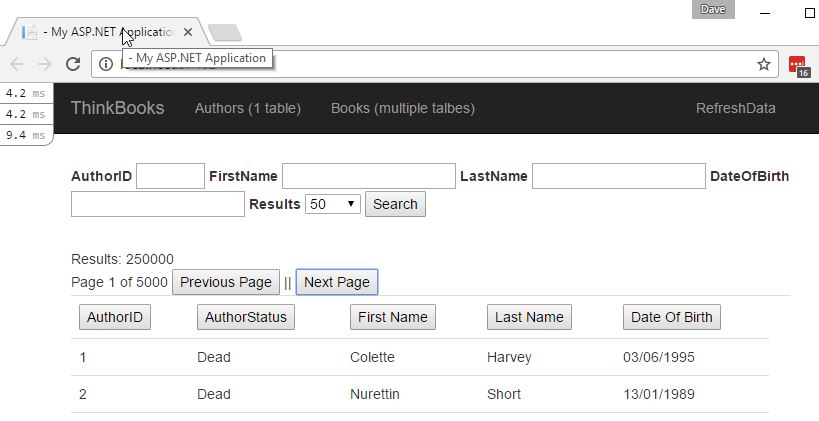
380ms to 9ms - much much faster! The other 2 times are browserlink javascript calls from visual studio.
5. API calls
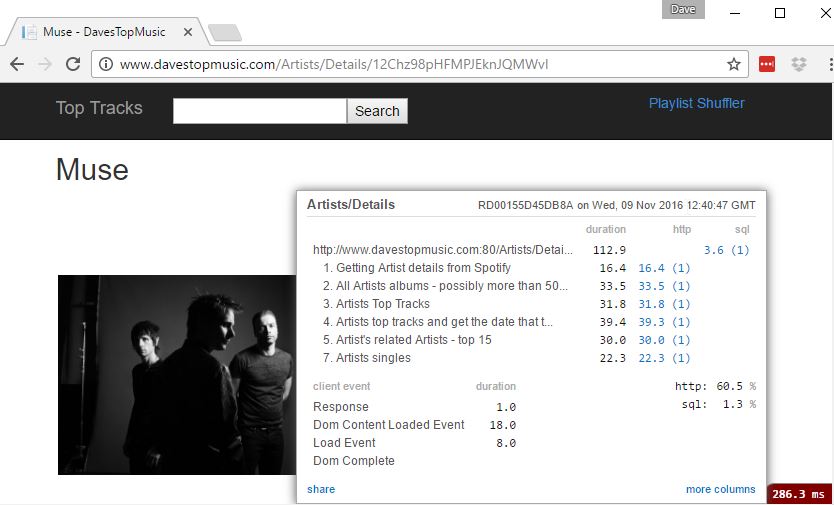
A project of mine which does many calls to the Spotify API. On this page there were 6 API calls, and 1 SQL call. MiniProfiler was very useful in highlighting which API calls were taking the most time Interestingly I found issues with Azure’s DNS, which meant it was much faster to run on EC2 for a while (was a geolocation lookup issue). Also I found doing API calls in parallel worked well for Spotify (whose response times are fantastic).
was a live site - http://www.davestopmusic.com/Artists/Details/12Chz98pHFMPJEknJQMWvI
6. Controller and View Profiling
A little bit more information can be had on controller and view instrumentation here
Conclusion
Performance is an essential part of any business application, and a Feature
I use MiniProfiler to quantify performance.